All You Need for Trading Stocks is Stock Prices!
Major Trend Reversal Trading Signals
U-TURN ‡ TURN-AROUND ‡ FULL-STOP ‡ FREE-FALL ‡ REVERSE ‡ WEEKLY-REVERSAL ‡ 3-WEEK
TEST ‡ JUMP-START

All You Need for Trading Stocks is Stock Prices!
Major Trend Reversal Trading Signals
U-TURN ‡ TURN-AROUND ‡ FULL-STOP ‡ FREE-FALL ‡ REVERSE ‡ WEEKLY-REVERSAL ‡ 3-WEEK
TEST ‡ JUMP-START
"Absolutely
the Best Technical Analysis and Marketing Timing Book Available"|
*eBay
Buyer yeouyeou![]() eBay#4536561214 (344
eBay#4536561214 (344![]() )
)


SIGNAL
-R1: U-TURN- A strong stock trading strategy
Here on this page you will learn about one powerful
trend reversal signal. Few minutes spent on this page will go a long
in impoving your success in trading. We will see this signal for two
situations. One pointing a trend reversal from a downtrend to an up-trend
and the other one pointing a reversal from an uptrend to a downtrend.
U-TURN (BUY)
U-TURN (SELL)
(Note:
If you get confused by some term(s) used on this page, you can look
at that term by clicking on this
link. Don't give up. Try to understand this signal because this
can make you lots of money. Feel free to contact
me.)
U-TURN (BUY) is one of my most favorite signals. As mentioned earlier, the (BUY) version of U-TURN takes place when a stock is in a down-trend and is like to enter into an up-trend. It signals possibilities about the start of an up-trend.
Assume
a stock is going down for quite some time. The following are quotes for
the latest two days:
| Today | 22, 27, 21, 26 |
| Yesterday (Previous day) | 25, 26, 23, 24
|
What
makes U-TURN a powerful trend reversal signal?
As we know, when a stock is in a downtrend, sellers out-number or out-power
buyers. In such circumstances, it is normal for the stock to keep making
lower Low prices as time passes. This reflects bearish, negative sentiment
or outlook for this stock. Now when trading starts for today, this stock
opens at a price lower than Previous Day's Low price. This is in line
and indicates continuation of the current bearish mood and reflects a
further build up of negative sentiment. Now if at some point in time during
the session, the stock stages a reversal and starts trading higher. This
is likely due to an emergence of fresh demand at current low price of
the stock. Now how can we determine that the stock is really staging a
reversal? To answer this question, following tests can help us differentiate
a strong reversal from a temporary emergence of buying. First, there has
to be a noticeable increase in volume since this turning point. Second,
it has to keep going up and cross Previous Day's Open and also the Close
price. If both these conditions are fulfilled, we can be sure that the
buying in the stock has been real and powerful. To take advantage of attractive
current low level of stock price, some influential players seem to have
started buying it decisively despite the strong negative sentiment held
by most other players. This buying is significant because it not only
absorbed what most players had to sell/offer, buyers kept asking for more
stocks even at higher prices. Today's demand not only absorbed the selling
pressure, but it even pushed the price higher than the prices of the Previous
Day! Isn't this a convincing reversal in stock prices?
This is a complete U-TURN (BUY) in the stock price trend and now with a Stop-loss at Today's Low price, one can start taking long positions.
These are the conditions required for the U-TURN (BUY) signal:
Key Points to remember: Current Trend- Down. Weak Open. Strong Bull Day. Increase in Volume.
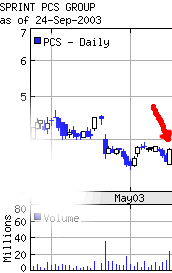
Here is an example: See the prices below for PCS (Sprint PCS Co.) during May 2003.
Daily Prices with Volume for PCS
16-May-03 |
3.5 |
3.81 |
3.5 |
3.8 |
23705400 |
15-May-03 |
3.67 |
3.71 |
3.55 |
3.55 |
12393200 |
14-May-03 |
3.78 |
3.82 |
3.64 |
3.67 |
10333600 |
13-May-03 |
3.8 |
3.84 |
3.75 |
3.78 |
5211000 |
12-May-03 |
3.75 |
3.86 |
3.75 |
3.85 |
9816100 |
9-May-03 |
3.82 |
3.84 |
3.78 |
3.84 |
6566900 |
8-May-03 |
3.79 |
3.84 |
3.75 |
3.82 |
3851600 |
When
you look at the Chart, you will notice that the stock is in a downtrend
(Condition 1). On the 16th, the stock opened at 3.50, which was
lower than Previous Day's Low of 3.55 (Condition 3). During today's
trading stock touched a low of 3.50 that was sort of the lowest
price for the last five to ten days (Condition 2). At the end of
the day, however the stock closed at 3.80, which was higher than
Previous Day's Open (3.67) and higher than Previous Day's Close
price (3.55) (Conditions 4 and 5). As you see, the volume on May
16th was also higher than the previous few days' volumes (Condition
6). Thus all the conditions were fulfilled here for a perfect U-TURN
(BUY) signal.
Here is the chart for PCS

ACTION: There are two primary variations of this signal as regards to Condition 2. The signal can take place at the end of a major trend as described above for PCS or it can take place at the end of a Correction or a Reaction.
In the first scenario, U-TURN (BUY) - in a Bear Market - is usually a very powerful signal and has the strength to change the current major trend from down to up-trend. Here you can expect the stock price or index to go up to the tune of 20%! So as soon as you have a U-TURN (BUY) in a major trend, you should be convinced of a trend reversal; and close short positions and you can also initiate fresh long positions to take advantage of this new emerging up-trend. So here in the case of PCS, Today's Low price was the recent lowest price so the U-TURN (BUY) today was likely to end the current down trend and initiate an up trend in PCS stock prices.
In the second variation, U-TURN takes place somewhere in the middle but not after a sustained trend. So Today's Low price may be the lowest price for only the last three to ten days, but not for the last few weeks! So the signal here may just mean the beginning or end of a Reaction/Correction. So what do you do here? You should not expect as much gain as you would in the first variation, but you can make new trades to take advantage of the price movement over the next three to ten days. If you understand major trends and Reactions/Corrections in prices, you will be able to distinguish these two variations and trade accordingly.
STOP-LOSS: As with any trading system, you must be alert to getting out of a position if the stock moves contrary to your expectations. The U-TURN signal works best most of the time but not always. If I were pressed for a figure, I would say it is correct around 70% of the time. However it also fails sometimes. So you should be watchful to protect yourself by selling your long position if the prices start going down. When to quit the position and book losses? It really depends on your risk-tolerance but I would advise you to keep a Stop-loss at Today's Low prices (minus 1%). Here in the case of PCS, we would keep a Stop-loss at 3.47.
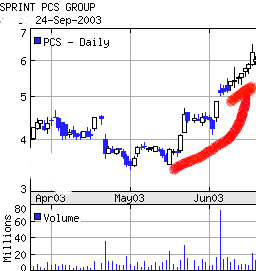
See
on the full Chart of PCS below for what happened after the signal took
place:
After giving a strong reversal U-TURN (BUY) signal on the 16th,
the stock was little idle for the next two days. This was an opportunity
for people like us to take a long position. Then on the next day the stock
jumped up again and took us to our target of 4.20. On the next day, the
stock continued its up movement and closed around 4.50 and then rested
for some time. Then after few days it restarted its journey and ultimately
it went as high as 6.50 within a month!
|
The beauty of this signal is that it tells you to take a position on the very day the stock is changing its course. You don't need a computer or fancy software to find occurrence of this signal or other signals discussed in this book. You can check for my signals just by looking at the daily prices of the stock on some websites. You can go Online and watch (and also download from the link at the bottom of the page) current as well as historical prices or charts on many website. Here is a link for viewing historical stock prices for any stock on Yahoo! (http://finance.yahoo.com/q/hp?s=AMZN) |
 |
|
Here is another example... Look at the chart of CNTY below for one more example of U-TURN (BUY) signal. Take a note of increase in volume on the day of the U-TURN (BUY) signal. An explosive up-trend in the prices was seen immediately after the signal, which gave 80% return over just few weeks! Who would not like to ride this kind of trend from the very first day of its beginning? (You have not learnt about GAP signal yet but come back to this page after you learn it.) |
|
Now let us look at how this powerful signal works in a reversed situation. Like the U-TURN (BUY) signal in a Bear market, U-TURN (SELL) signal is equally powerful to indicate a change in trend when a stock is going strong and is making new higher prices (in a Bull market). All of a sudden in a Bull trend the stock puts up a disappointing down day and surprises most people. Many people think this as just a Reaction and expect the stock to resume its continued ascending movement soon; but it does not happen most of the time when the reversal conditions of the U-TURN (SELL) signal are met.
eBook version of PROFIT FROM PRICES at 50%
discount to regular price
|
| Pay
with PayPal: (No PayPal account needed to make this purchase!) |
Google
Checkout: Click below to pay with a credit card on secure Google Checkout: |
Disclaimer: This trading system/signal, like any other system, may fail at times. Exercise caution when trading and decide suitability of any trade by taking into consideration market conditions, your financial situation, investment objectives and circumstances. Always keep a stop-loss when you are trading.
All
content on this website and the ProfitFromPrices eBook are copyrighted
material
COPYRIGHT © 2004 by Jayesh Patel
For privacy policy, click here. Google