All You Need for Trading Stocks is Stock Prices!
Major Trend Reversal Trading Signals
U-TURN ‡ TURN-AROUND ‡ FULL-STOP ‡ FREE-FALL ‡ REVERSE ‡ WEEKLY-REVERSAL ‡ 3-WEEK
TEST ‡ JUMP-START

All You Need for Trading Stocks is Stock Prices!
Major Trend Reversal Trading Signals
U-TURN ‡ TURN-AROUND ‡ FULL-STOP ‡ FREE-FALL ‡ REVERSE ‡ WEEKLY-REVERSAL ‡ 3-WEEK
TEST ‡ JUMP-START
| Rated a Good |
|
| Stock trading strategy book investment J Patel CFA (Mar 03 07:10 2005 PST) | |
| Comment: Excellent! This book which is a complete trading methodology, including specific setups, gives more detailed trading information than books by "big name" authors costing 4 - 10 times the price. You can't go wrong buying this book. (Mar 12 11:42 2005 PST) |
U-TURN (SELL):
Now let us look at how this powerful stock trading signal- U TURN- works in a reversed situation. Like the U-TURN (BUY) signal in a Bear market, U-TURN (SELL) signal is equally powerful to indicate a change in trend when a stock is going strong and is making new higher prices (in a Bull market). All of a sudden in a Bull trend the stock puts up a disappointing down day and surprises most people. Many people think this as just a Reaction and expect the stock to resume its continued ascending movement soon; but it does not happen most of the time when the reversal conditions of the U-TURN (SELL) signal are met.
Here are the conditions for the U-TURN (SELL) signal with Bearish implications in a Bull market. Please note that the signal discussed here takes place when the stock is in a up-trend (Bull market) but the signal actually indicates that the stock is about to enter into a Bear market or a down trend.
Key Points to remember: Current Trend- Up. Strong Open. Strong Bear Day. Increase in Volume.
ACTION: There are two primary variations of this signal with regard to Condition 2. The signal can take place at the end of a major up-trend or it can take place at the end of a Correction.
In the first scenario, U-TURN (SELL) is a very powerful signal and has strength to change the current major trend from up-trend to downtrend. Here you can expect the stock price or index to go down to the tune of 20%! So as soon as you have a U-TURN (SELL) in a major up trend, you should be convinced of a trend reversal; and you should close Long positions and you can also initiate fresh Short positions to take advantage of this new emerging down-trend.
In the second variation, U-TURN (SELL) takes place somewhere in the middle but not after a sustained trend. So Today's High price may be the highest price for the last three to ten days, but not for the last few weeks! So the signal here may just mean the beginning or end of a Reaction/Correction. So what do you do here? You should not expect as much drop in prices as you would in the first variation, but you can make new trades to take benefit from the price movement over the next three to ten days. If you understand major trends and Reactions/Corrections in prices, you will be able to distinguish these two variations and trade accordingly.
STOP-LOSS: When to book losses in U-TURN (SELL) signals? It really depends on your risk-tolerance but I would advise you to keep a Stop-loss at Today's High prices (plus 1%).
Let us see this with an example:
Daily Prices with volume for TIVO
7-Jul-03 |
14.05 |
14.51 |
12.75 |
12.88 |
3768100 |
3-Jul-03 |
13.05 |
13.75 |
12.78 |
13.5 |
1194300 |
2-Jul-03 |
12.34 |
13.39 |
12.23 |
13.22 |
2675400 |
1-Jul-03 |
12.35 |
12.35 |
11.75 |
12.22 |
1048200 |
30-Jun-03 |
12.75 |
12.75 |
11.75 |
12.09 |
2388100 |
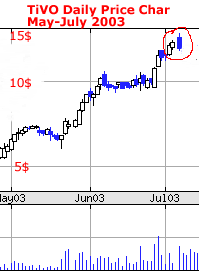
As you see on the Chart to the right, the stock was making new high prices day after day (Condition 1). However on July 7th, TiVo opened at 14.05 which was higher than the 13.75 of Previous Day's High (Condition 3). Also Today's High of 14.51 was the highest price for TiVo over the last few weeks (Condition 2). After touching a high of 14.51, it started going down during the day and closed at a price that was lower than Previous Day's Open as well as lower than the closing price (Conditions 4 and 5). Volume was also very high on the day (Condition 6).
Here is the chart of TIVO

Thus we had a perfect U-TURN (SELL) signal on TiVo. If you were following this signal, you would have easily sensed profit taking that happened in TiVo on that day and also would have sensed the intensity of supply/selling in the stock. It was obvious that despite the recent up-trend, sellers did not mind selling positions or shorting the stock even at lower prices during the day!
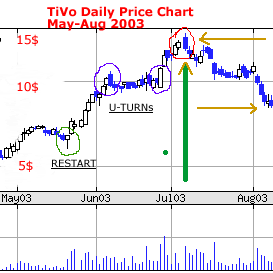
See at the Chart to the right for what happened after the U-TURN (SELL) signal occurred in the stock.
After making a TOP on the U-TURN (SELL) day at 14.50, the stock entered into a down trend and went down to touch 8.00 in a week.

|
|
|
I would also like to mention one more U-TURN (SELL) signal on the Chart above. If you look at the beginning of June, there was a U-TURN (SELL) signal at a previous TOP price (slightly above 10$). This U-TURN signal did end the up-trend but the stock did not enter into a clear downtrend here. It just got into a Sideways-trend. Thus you can see how U-TURN temporarily stops a major trend and starts a Reaction. Now if you look a little further to the right (toward end of the sideways movement), you will see a big white candle. This was probably another U-TURN (BUY) signal (from bear to bull trend, with Bullish implications). However the day's low price wasn't the lowest price for the last few weeks! So it was a weak U-TURN (BUY) signal (Variation 2 discussed above) and was just pointing to the end of the Reaction and a resumption of stock price movement in the direction of the major trend- an up trend.
Some more signals if you have familiarized yourself with the other signals discussed in this book. You should be able to identify a RESTART signal (discussed later) at the end of the first Reaction in the Chart above- around the 6$ level. See how it marked the end of the Reaction and restarted the price movement in the direction of the major trend! Also there is also the failure of a TURN-AROUND signal on June 30th (three days prior to the major U-TURN (SELL) signal we have discussed in the beginning of the section).
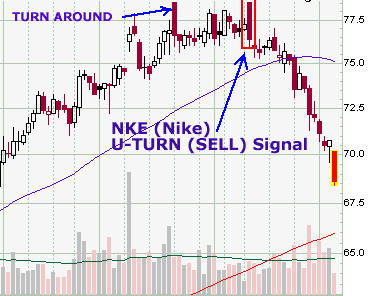
Let us now look at one more example of U-TURN (SELL) Signal.

"Chart courtesy of StockCharts.com"
Look at the chart of Nike, inc. (NKE) for the U-TURN (SELL) signal. As soon as we had our signal, NKE showed end of its up-trend and entered into a nice downtrend. There wasn't any bad news about the company which prompted the down-trend but it was probably action of some influential investors who might have seen this high price of 77$ as an opportunity to book profit or maybe they were smart hedge funds or short sellers who had started selling NKE!!! It does not matter for us who were behind this sell-off but our U-TURN (SELL) signal did tell us about this beginning of the fall in prices on the day when the stock hit its High price! We have not yet learned about TURN AROUND (SELL) signal but you will find an instance of that signal few days prior to U-TURN (SELL) signal on the chart. If you notice, the TURN AROUND (SELL) signal was also effective and its stop-loss was never triggered. Thus, after TURN AROUND (SELL) signal, when we had U-TURN (SELL) too after few days at the same Top prices, there was money for us in short selling NKE during April 2004!
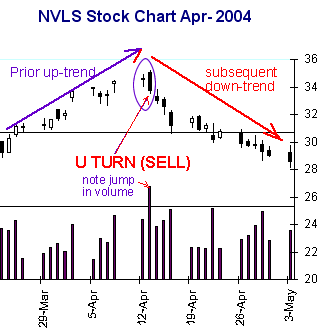
Here is one more example of a U-TURN (SELL) signal. As shown on the Chart on the right, NVLS stock was in a strong up trend. When it was around the High of 35$, company came out with stellar earnings. The stock was traded higher in after-markets. It also opened strong on the next day but closed significantly lower with a significant increase in volume. This was our U-TURN (SELL) signal. See on the chart, how the stock changed its course and touched a Low price of 28$ within 2/3 weeks!

Want to look at more current examples of Profit From Prices' stock trading signals? click here.
Did you like reading about U TURN stock trading signal? Click here to read about other major trend reversal signal- WEEKLY REVERSAL.
If you want to look at a sample Short-term trading signal, you can click on the Short-term signals button on the top or click here.Want to see the performance of this signal? Out of curiosity, I back tested both versions of this signal for the first half of 2004 on stockfetcher.com.
For the U TURN (BUY) signal:
Annualized Return
on Investment (ROI): 22.82% versus the ROI of ^SPX was: 4.81%.
(Click here for an EXCEL file with
all details about his back-testing.)
For the U TURN (SELL) signal:
Annualized Return
on Investment (ROI): 24.60% versus the ROI of ^SPX was: 4.81%.
(Click here for an EXCEL file with
all details about his back-testing)
eBook version of PROFIT FROM PRICES at 50%
discount to regular price
|
| Pay
with PayPal: (No PayPal account needed to make this purchase!) |
Google
Checkout: Click below to pay with a credit card on secure Google Checkout: |
Disclaimer: This trading system/signal, like any other system, may fail at times. Exercise caution when trading and decide suitability of any trade by taking into consideration market conditions, your financial situation, investment objectives and circumstances. Always keep a stop-loss when you are trading.
All
content on this website and the ProfitFromPrices eBook are copyrighted
material
COPYRIGHT © 2004 by Jayesh Patel
For privacy policy, click here. Google