
All You Need for Trading Stocks is Stock Prices!
Short Term Trading Signals
GAP ‡ RESTART ‡ MONDAY-MORNING ‡ TURN-BACK ‡ OPTIONS-EXPIRATION ‡ FLAG-PENNANT ‡ TREND-LINES

All You Need for Trading Stocks is Stock Prices!
Short Term Trading Signals
GAP ‡ RESTART ‡ MONDAY-MORNING ‡ TURN-BACK ‡ OPTIONS-EXPIRATION ‡ FLAG-PENNANT ‡ TREND-LINES
| Rated a Good |
|
| Stock trading strategy book investment J Patel CFA (Mar 03 07:10 2005 PST) | |
| Comment: Excellent! This book which is a complete trading methodology, including specific setups, gives more detailed trading information than books by "big name" authors costing 4 - 10 times the price. You can't go wrong buying this book. (Mar 12 11:42 2005 PST) (most recent) |
SIGNAL C2: RESTART
If you
like the content on this page, please do share with your friends on Facebook:
There are two versions
of this signal:
* RESTART (BUY) in a BULL MARKET
* RESTART (SELL) in a BEAR MARKET
(Note: At the end of the page, you will see instructions for how to do a quick test of this signal on US stocks.)
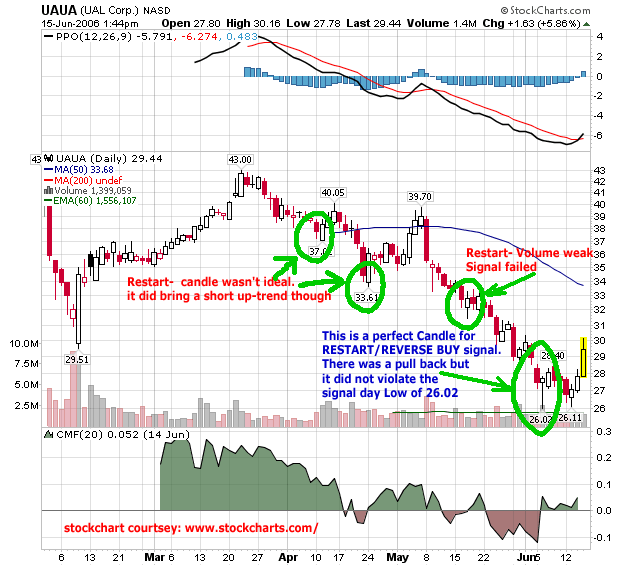
This signal indicates continuation of the up- or the down- trend after a Reaction or a Correction. For a stock in a Bull trend, its price has an overall upward movement but as we know this movement is not continuous. The stock does not keep going up every day. The stock may go up a few days and then profit-taking or selling increases at a higher level and the stock goes down for a few days. This is a like a pause before it continues its upward movement. These types of movements that are contra to the main trend are called Reactions in a Bull trend. In other words, a Reaction is a temporary pause of the bullish trend. Similarly in a downtrend, when a stock goes up for a few days, we call this temporary up-trend in a major downtrend as Corrections.
The signal we are going to discuss is primarily used to spot when the stock is likely to end its Reaction/Correction and resume its main trend. So let us call it the RESTART signal because all it does is to tell us that the main trend is about to restart. Like the previous signal (GAP), this RESTART signal is also easier to spot on a chart; but if you are just looking at just daily prices, it is not that difficult to find its occurrence. This signal mostly occurs on a daily chart but sometimes it can be in weekly prices or on weekly chart too.
Let us first discuss conditions that form the basis for this RESTART (BUY) signal, and then we will take an example.
Conditions:
Here is how you can find this signal on a Candlestick chart:
BRIEF
EXPLANATION: The stock is in an up-trend for the last few weeks/months.
However for the last few days (roughly three to ten days), the stock seems
to be going down or seems to have stopped its up-trend. This makes many
people doubt the continuation of the up-trend.
What is happening in this situation is simple: the Demand and the Supply
phenomena of Economics are at work. AS the stock has kept going up for
the last few weeks/months and has made a new high price, the Demand is
going down and there is likely to be some profit-taking or even short
selling at such a high level. So it is as if the stock were in a pause
or were resting so when it is ready, it can resume its up-trend with much
more vigor.
What does this signal mean? As said the stock is in a powerful up-trend
but it is trading lower for the last few days. Today it makes a significantly
lower Bottom than yesterday's low price and Today's Low is also the lowest
price since the Reaction set in. Now after making a lower low, the stock
turns back and starts going up usually with a relatively heavy volume.
Now when it trades higher than Today's Open, it makes today a Bull Day.
So it seems the RESTART (BUY) signal is in the making and when it goes
higher than Previous Day's Close, we have this signal confirmed. You can
close your short positions if any and can initiate long positions at this
time with a Stop-loss at Today's Low price. However you have to look at
today's closing price and see if all conditions are still fulfilled. If
today is a Bull Day and Today's Close is also higher than Previous Day's
Close, we can confer that there was some powerful shift in Demand today.
This wasn't just some emotional or psychological buildup overnight but
today's lower price attracted new buying in the stock and also sellers
are not willing to sell at these lower prices. So the combined effect
could be pretty positive for the stock.
Let us take an example from AMZN (Amazon.com).
Daily prices of AMZN:
1-Oct-03 |
48.37 |
49.28 |
47.51 |
49.12 |
12563800 |
30-Sep-03 |
49.65 |
49.76 |
48.35 |
48.43 |
9264600 |
29-Sep-03 |
48.88 |
49.97 |
48.4 |
49.86 |
9039300 |
26-Sep-03 |
49.9 |
50.46 |
48.3 |
48.56 |
13438500 |
25-Sep-03 |
49.66 |
50.95 |
49.28 |
50.05 |
11033300 |
24-Sep-03 |
50.35 |
51.3 |
49.6 |
49.61 |
15330200 |
During 2003, AMZN was in a strong upward trend. Daily prices/the chart shown here are for the Reaction period (Condition 1). As you can see, prices during the Reaction were going down. Then on Oct 1st, AMZN opened at 48.37, kept going down and touched a low of 47.51. This Today's Low of 47.51, was significantly lower than Previous Day's Low of 48.35 (Condition 2). Today's Low price was also the lowest price for the current Reaction (Condition 5).
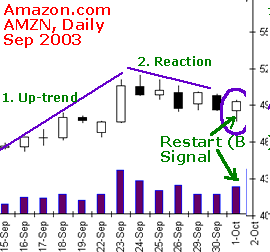
After trading as low as 47.51, the stock changed its course and when it traded higher than Today's Open price (48.37) it created a possibility of today being a Bull Day (Condition 3). Then when it traded higher than Previous Day's Close of 48.43, it was a RESTART (BUY) (a kind of reversal) in the making (Condition 4). The volume was also somewhat higher than the daily volume over the last two days.
Now when the trading ended for Oct 1, AMZN actually closed at 49.12 as we might have hoped after it crossed 48.43. So based on the closing prices, we had a confirmed RESTART (BUY) signal.
ACTION: When this signal takes place during a Reaction, it indicates that stock is back to it major up-trend and you can expect it to not only cross the Previous Top but also make a higher Top. In the event of this signal taking place, you should close your short positions and initiate new long positions.
STOP-LOSS: Possible Stop-loss levels are Today's Low price, or Previous Day's Close price. However the recommended Stop-loss would be at Today's Low price minus around 1%.
PRICE OBJECTIVE: Once this signal takes place, you can expect the stock to cross the last Top and make a new higher Top.
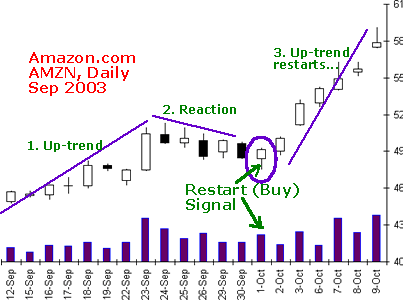
Now let us look at a complete chart of AMZN after the RESTART (BUY) took place. As seen from the chart below, the stock continued its upward journey. It did not go below the low price of the day of the signal but crossed the previous high of 51$ and ultimately made a new high of 59$ over just two weeks.
Daily prices of AMZN:
|
9-Oct-03 |
57.41 |
59.1 |
57.4 |
57.86 |
21606900 |
|
8-Oct-03 |
55.44 |
56.28 |
55.12 |
55.7 |
13558000 |
|
7-Oct-03 |
54 |
56.25 |
53.95 |
54.91 |
20299900 |
|
6-Oct-03 |
52.89 |
54.24 |
52.59 |
54.15 |
7773100 |
|
3-Oct-03 |
51.13 |
53.22 |
51.03 |
52.89 |
14175600 |
|
2-Oct-03 |
48.94 |
50.2 |
48.68 |
50.09 |
8219900 |
|
1-Oct-03 |
48.37 |
49.28 |
47.51 |
49.12 |
12563800 |
|
30-Sep-03 |
49.65 |
49.76 |
48.35 |
48.43 |
9264600 |
|
29-Sep-03 |
48.88 |
49.97 |
48.4 |
49.86 |
9039300 |
|
26-Sep-03 |
49.9 |
50.46 |
48.3 |
48.56 |
13438500 |
|
25-Sep-03 |
49.66 |
50.95 |
49.28 |
50.05 |
11033300 |
|
24-Sep-03 |
50.35 |
51.3 |
49.6 |
49.61 |
15330200 |
As you can see from the prices above and also from the Chart here, Oct 1 proved to be the actual end of the Reaction AMZN was going through. Since then, AMZN resumed its upward movement and made a high price of 59 only within the next ten trading days.
RESTART (SELL) in a BEARISH TREND:
Let us now see how a RESTART signal works in a primary downtrend As we know during a downtrend, a stock often has a few up days during which the stock seems to be going up. This point in time may be actually confusing. It is hard to differentiate if an actual trend reversal is going on or may be just that a Correction is taking place. So in the middle of such a crucial time, if you see this signal taking shape, it tells you that the stock is still not done with its downtrend! You can expect it to not only cross the Previous Bottom but a new lower Bottom may be formed. So like a GAP, this signal also indicates the continuation of the downtrend and you can expect new lower prices in the stock. Let us first list down the conditions that form this signal and then we will take one historical example.
Conditions:
Let us take an example to understand this signal in a downtrend When you look at the Chart below of EELN (eLoan.com), you will see EELN in a definite downtrend. However during early August, it seemed to be in Sideways with daily prices becoming more stable in comparison to the strong downtrend of the last few weeks. Now on August 8th, the stock gave us a RESTART (SELL) signal telling us that with a Stop-loss of around 4.14, you can short sell EELN and can expect it to make a new low Bottom. Let us see how this RESTART (SELL) signal took place on that day.
Daily prices of EELN (eLoan.com):
8-Aug-03 |
4.02 |
4.1 |
3.9 |
3.94 |
1800300 |
7-Aug-03 |
4 |
4.05 |
3.85 |
4 |
1551800 |
6-Aug-03 |
3.95 |
4.07 |
3.75 |
3.93 |
1923700 |
5-Aug-03 |
4.02 |
4.04 |
3.84 |
3.88 |
1633700 |
4-Aug-03 |
3.75 |
4.05 |
3.65 |
4.02 |
3214500 |
1-Aug-03 |
4.05 |
4.08 |
3.75 |
3.85 |
5320800 |
31-Jul-03 |
4.58 |
4.59 |
4.08 |
4.15 |
4761200 |
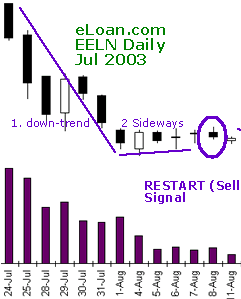
As evident from the Chart, EELN was in a downtrend but over the recent few days it demonstrated that it was in a Sideways movement. So the downtrend seemed to end for the last five to six days (Condition 1). Now on August 8th, EELN opened at 4.02 and made a high of 4.10 that was higher than the Previous Day's High, on Aug 7 of 4.05, fulfilling our Condition 2. Today's High of 4.10 was the recent highest price (for the last six days), fulfilling our Condition 5. As trading continued on Aug 8th, EELN started going down and when it traded at below 4.00, it made the day a Bear Day (Close of 3.94, lower than the day's opening price of 4.02) (Condition 3) and it was also trading lower than Previous Day's Close (Condition 4). Volume was also a little higher than the average volume of the last three days.
Thus we had almost all conditions fulfilled to make August 8th a RESTART (SELL) signal day indicating that the last few week's downtrend may resume again pushing EELN prices down to form a new lower Bottom. You can note the volume wasn't significantly higher and also the difference between the high price of Aug 8th and the high price of Aug 7th was only 5 cents. Both these facts made our signal a little weak but still it was a complete RESTART (SELL) signal.
Now look below at EELN's prices and also the Chart to see what happened after we had this signal.
Here is what happened to EELN after the RESTART (SELL) signal on Aug 8th.
|
25-Aug-03 |
3.22 |
3.25 |
3.11 |
3.18 |
1804200 |
|
22-Aug-03 |
3.46 |
3.5 |
3.23 |
3.23 |
1809900 |
|
21-Aug-03 |
3.5 |
3.54 |
3.41 |
3.41 |
1210200 |
|
20-Aug-03 |
3.56 |
3.63 |
3.41 |
3.44 |
1297600 |
|
19-Aug-03 |
3.84 |
3.87 |
3.61 |
3.64 |
1485000 |
|
18-Aug-03 |
3.61 |
3.84 |
3.57 |
3.79 |
1575900 |
|
15-Aug-03 |
3.7 |
3.77 |
3.53 |
3.56 |
789500 |
|
14-Aug-03 |
3.5 |
3.78 |
3.34 |
3.73 |
2490500 |
|
13-Aug-03 |
3.91 |
3.91 |
3.4 |
3.57 |
4326900 |
|
12-Aug-03 |
3.9 |
3.94 |
3.82 |
3.89 |
1029100 |
|
11-Aug-03 |
3.88 |
3.95 |
3.83 |
3.92 |
1003000 |
|
8-Aug-03 |
4.02 |
4.1 |
3.9 |
3.94 |
1800300 |
|
7-Aug-03 |
4 |
4.05 |
3.85 |
4 |
1551800 |
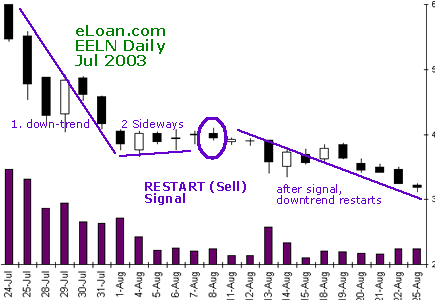
After this Correction (or a Sideways movement) during the first few trading days of August 2003, the RESTART (SELL) signal indicated that the downtrend was again likely to gain momentum and this was exactly what happened there after. EELN kept sinking and made a low of 3.34 on the fourth trading day (August 14th). Then if you look at the prices, there was another minor up trend (or you can call it Sideways) phase for the next three days, Aug 14th to Aug 18th. After making a higher high of 3.87 on August 19th, EELN closed at 3.64 which was lower than Previous Day's Close price of 3.79 as well as lower than Today's Open of 3.84 (a Bear Day). Thus on the 19th, we had a RESTART (SELL) signal once again. However this was a weak signal as on the 19th, the high of 3.87 was only slightly higher than Previous Day's High or 3.84. Volume wasn't much higher either. Anyway, this RESTART (SELL) signal pointed out that EELN was likely to go below the last bottom of 3.34. If you look down the four following days, you will see that EELN broke below 3.34 and made a new low price of 3.10!
If you
liked the content on this page, please do share with your friends on Facebook:
(Note: If you get confused by some term(s) used on this page, you can look at that term by clicking on this link. Don't give up. Try to understand this signal because this can make you lots of money. Feel free to contact me if you have any questions or to provide feedback.)
Disclaimer: This trading system/signal, like any other system, may fail at times. Exercise caution when trading and decide suitability of any trade by taking into consideration market conditions, your financial situation, investment objectives and circumstances. Always keep a stop-loss when you are trading.
All
content on this website and the ProfitFromPrices eBook are copyrighted
material
COPYRIGHT © 2004 by Jayesh Patel
For privacy policy, click here. Google